Grafana
I used data from TimescaleDB.
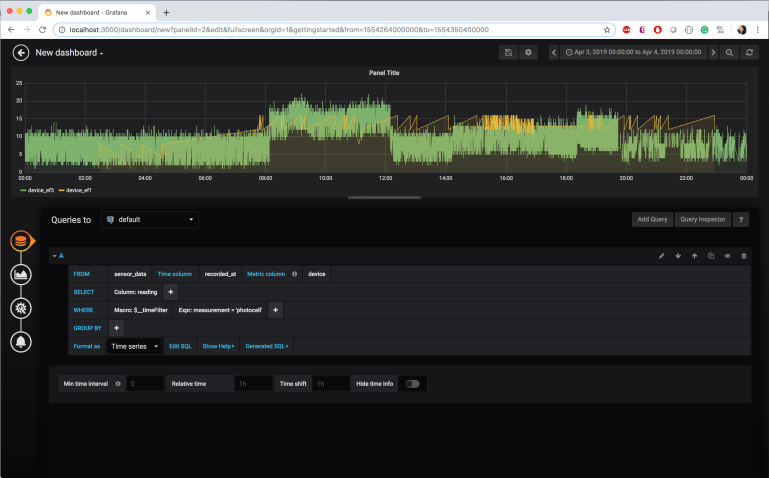
This dashboard is visualizing the data in 24 hours (2019-04-03 14:00:00 – 2019-04-04 14:00:00) from the photocells on device_ef1 (yellow: ITP room 20) and device_ef3 (green: ITP conference room). Device_ef2 in Room 50 kept breaking so no data was collected.
From the visualization, we can see the lighting in Conference Room fluctuates more comparing to Room 20. Room 20 is brighter than the Conference Room in the afternoon between 12pm – 16pm and the evening between 20pm – 00am. The lighting is similar in the morning between 8am – 12pm in these 2 rooms. The Conference room has a significant drop at 12pm and graduate increase between 12pm – 20pm.
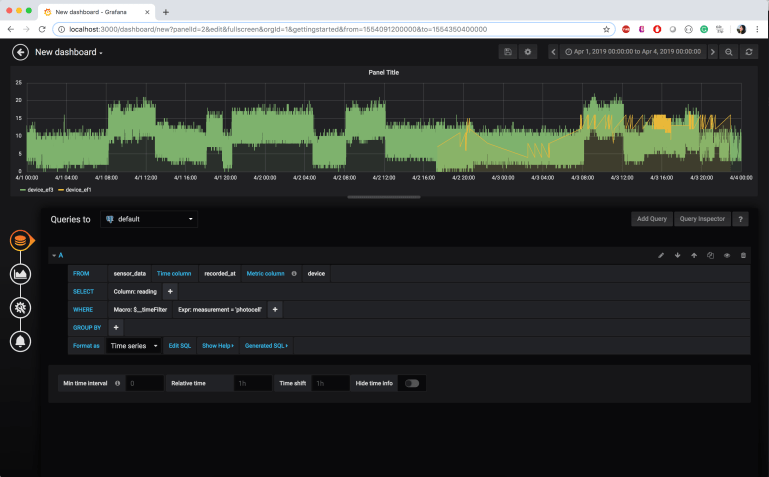
This dashboard shows the lighting condition between 2019-04-01 to 2019-04-03 in the conference room. I can see that the 12pm lighting drop is pretty consistent every day. And the night of 4/1 was brighter than 4/2. Perhaps someone was having a late night in this room.
The query:
SELECT
recorded_at AS “time”,
device AS metric,
reading
FROM sensor_data
WHERE
$__timeFilter(recorded_at) AND
measurement = ‘photocell’
ORDER BY 1,2
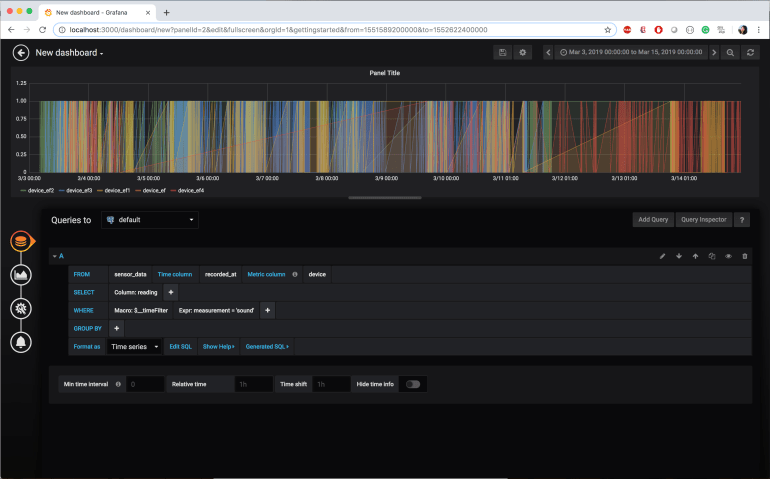
This dashboard is from the sound sensor on device_ef1 (yellow: ITP room 20), device_ef2 (green: ITP room 50), device_ef3 (blue: ITP conference room), device_ef4 (red: my apartment room in East Village) recorded between 2019-03-03 to 2019-03-14.
From the visualization, I can see that Room 50 (green) is the quietest room comparing to the other two rooms in ITP.
The query:
SELECT
recorded_at AS “time”,
device AS metric,
reading
FROM sensor_data
WHERE
$__timeFilter(recorded_at) AND
measurement = ‘sound’
ORDER BY 1,2
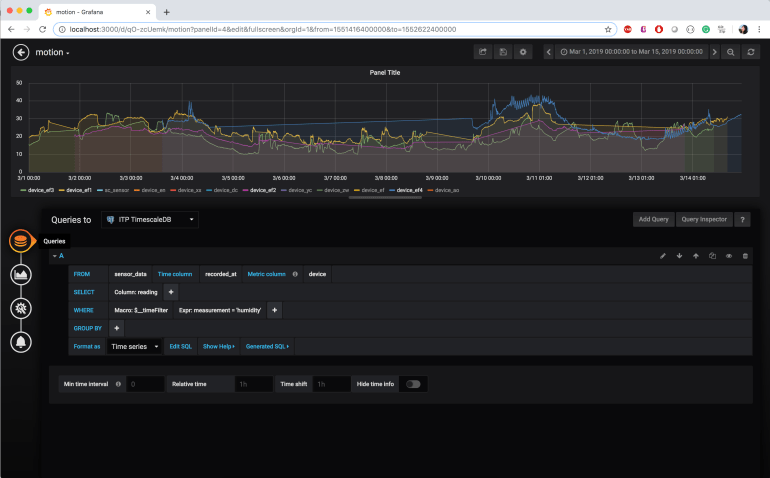
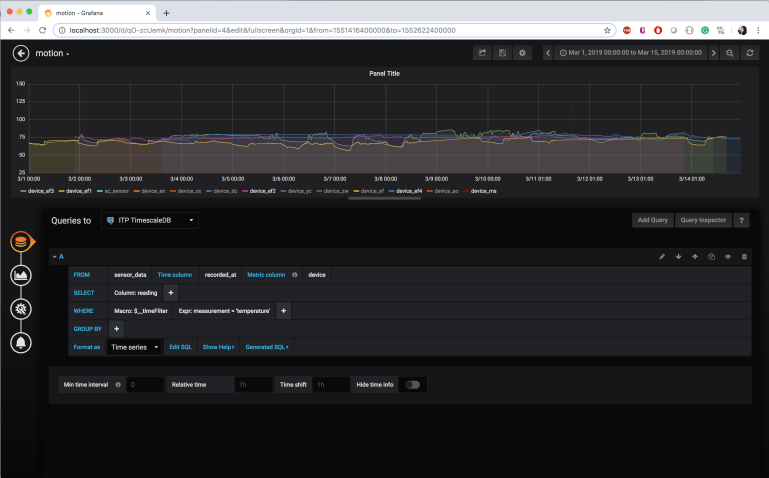 These two dashboards are from the temperature and humidity sensor on device_ef1 (yellow: ITP room 20), device_ef2 (purple: ITP room 50), device_ef3 (green: ITP conference room), device_ef4 (blue: my apartment room in East Village) recorded between 2019-03-01 to 2019-03-14.
They show that my apartment room is the most humid which is not surprising because I always have a humidifier turned on in my room. My room is also generally warmer than the rooms in ITP.
In ITP, the humidity level is Room 20 > Room 50 > Conference Room.
In ITP, the temperature Room 50 > Conference Room > Room 20.
No wonder everyone says room 20 is always cold!
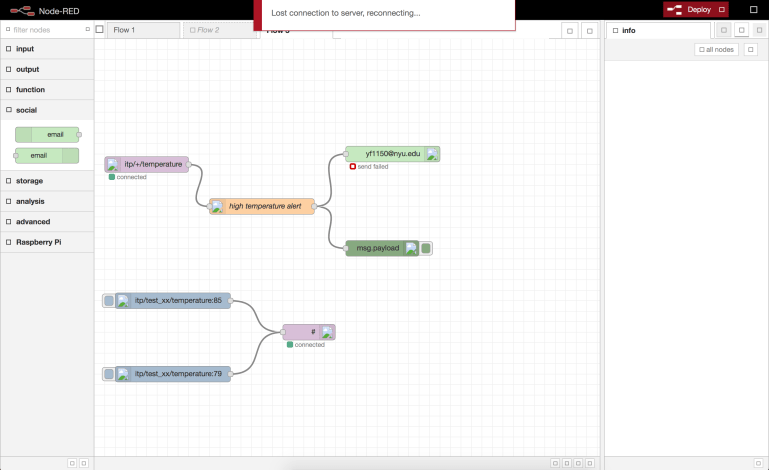
Node-RED
Couldn’t get the email to work. Still working on it…
AWS
Arduino code for my loneliness device:
https://github.com/effyfan/DeviceToDatabase/tree/master/assign6/AWS_loneliness
